Publication Quality Graphs Using MATLAB
MATLAB is an excellent tool. It is equally popular among students, researchers and professors. If you use MATLAB for your project/research, you probably know that it is not easy to create publication quality graphs (PQGs) using MATLAB. You will have to call a billion set and get functions to create a decent plot with desired height, width, fonts, line width, color etc. Here, I present PlotPub which is a collection of MATLAB functions and a MATLAB class that allows you to modify almost all aspects of MATLAB figures and export PQGs using one function call and a simple structure.
NOTICE#1: The tutorial for PlotPub has been moved here.
NOTICE#2: Tutorial on Publication Quality Subfigure in Inkscape.
NOTICE#3: The previous version of this page can be found here.
Contents
News
- Mar 18, 2015: v2.0 released.
- Jan 17, 2015: v1.4 released.
- Sept 28, 2014: A tutorial on how to create subfigure using PlotPub and Inkscape posted.
- Sept 24, 2014: We are on MATLAB File Exchange.
- Sept 23, 2014: v1.3 released.
New features of v2.x
- Simple and elegant object oriented approach: all aspects of the MATLAB figure is encapsulated in the Plot class.
- Create new plots, open saved figures or change existing figure using the same call, Plot().
- Control every aspect of a MATLAB figure using the Plot class object.
- Property changes are immediately visible, useful when using from the command window
- Even easier to use.
- Fully compatible to v1.x.
What's New in v1.4?
- Added an option for adding title.
What's New in v1.3?
- Several bugs are fixed including marker spacing.
- New options for axis color, axis line width, tick direction, tick length, minor ticks, legend box, legend text color etc.
- New, more appealing default look.
Features of v1.x
- Generate beautiful, publication quality graphs from instantly generated MATLAB figures or saved MATLAB fig files.
- Export figures in EPS, PDF, JPEG, PNG and TIFF with adjustable resolution.
- Set marker spacing.
- Change almost all aspects of a figure using simple and intuitive code.
- A lot of example codes. A decent tutorial and good documentation.
- Tested in Ubuntu and OSX with MATLAB 7.10. But it should work in other operating systems with other versions of MATLAB.
- Distributed under BSD license which allows you to do anything you like.
Compatibility with v1.1
In version 1.2, I introduced a new function setPlotProp which is superior to the old function plotPub. But for backward compatibility, plotPub is still available in v1.2+. Therefore, all of your previous codes should work with v1.2+.
Downloads
Download the latest stable version from the link below. If you are interested in development, please visit the GitHub page. The most recent development version is available here.
Inastallation
Download and extract the zip file from the link given above. Install PlotPub using any one of the three possible ways: (1) copy all the *.m files inside the lib folder to either your MATLAB path or (2) copy those files to your current project folder or (3) put plotPub-master in any convenient folder and add the following line in your MATLAB code:
addpath('D:/MATLAB/PlotPub-2.0');
where, I assume that you put plotPub-2.0 in D:/MATLAB folder. The sample codes can be found inside the examples folder.
Documentation
For more information, please visit the following pages:
- Tutorial and reference manual (v2.0 or later)
- Tutorial and reference manual (v1.1 or later)
- GitHub README page
- GitHub Wiki
Bugs and Feature Request
If you find any bug/problems/issues, please report it here. If you want new features, please add a request here.
If you have any comment, want me to explain anything, find any bug or include a new feature to the code and share with others, please let me know.
Known issues
- Does not work with sub-figures
Gallery
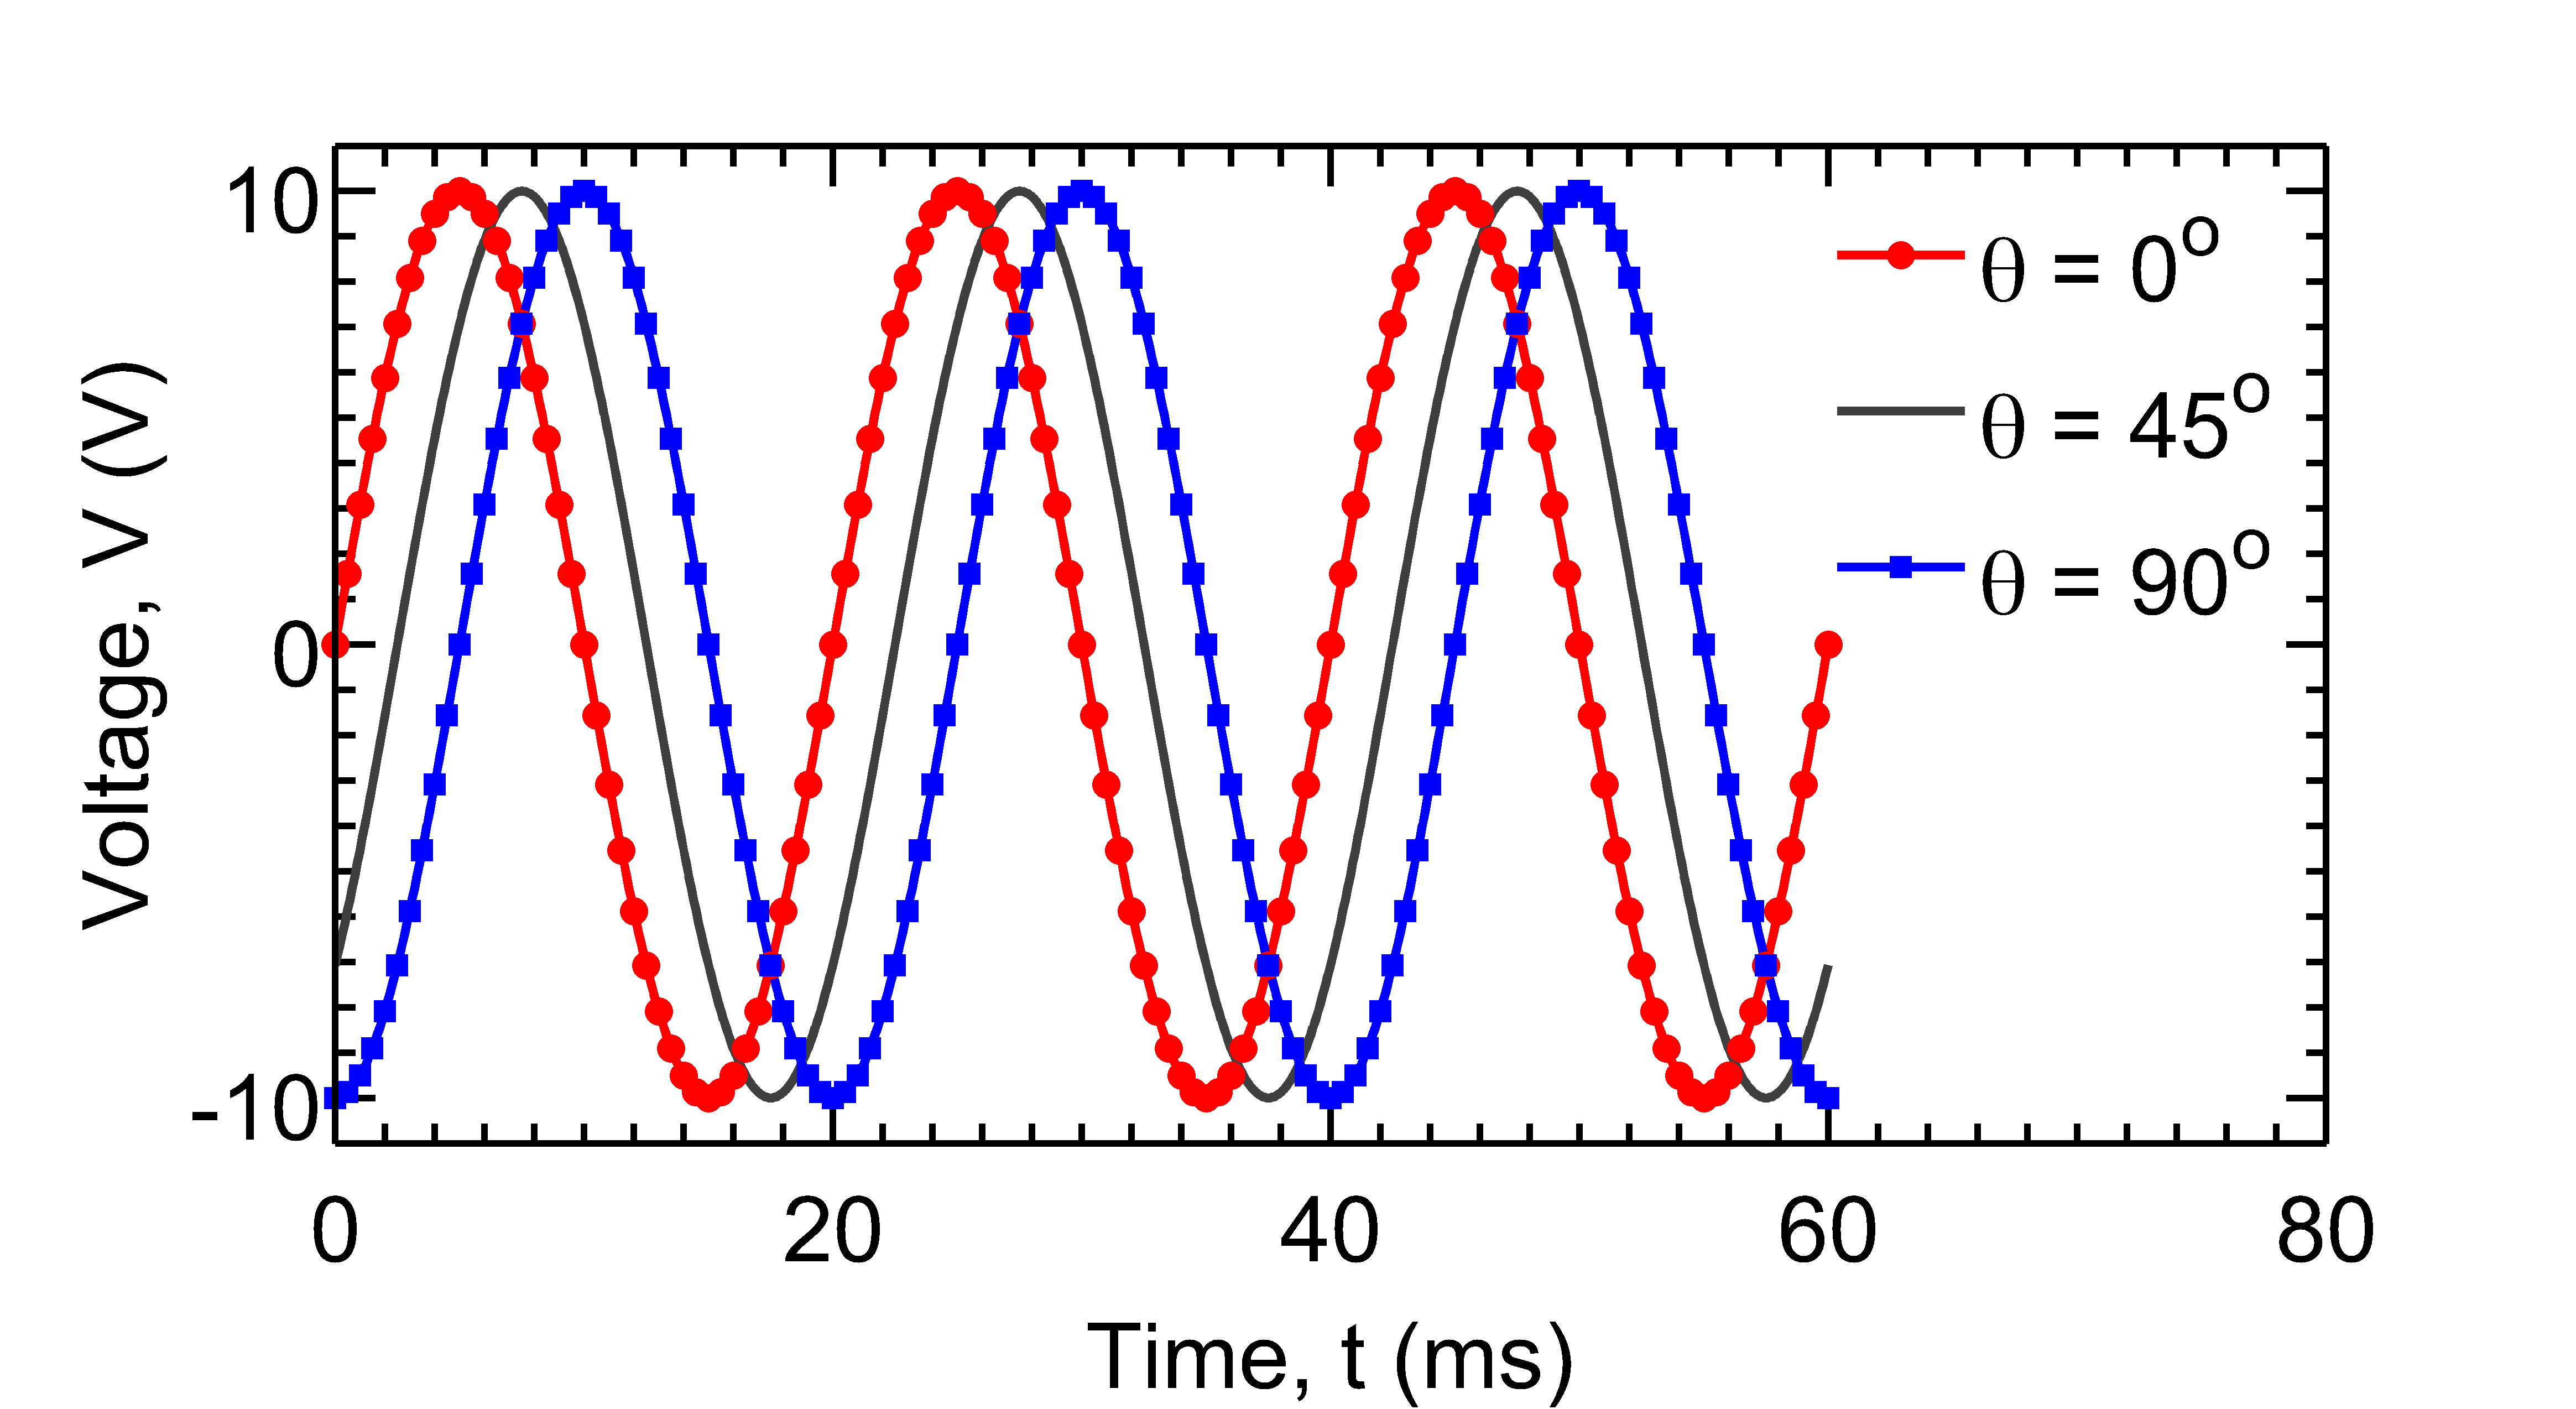
Showcasing plotpub - multiple plots with marker and legend.
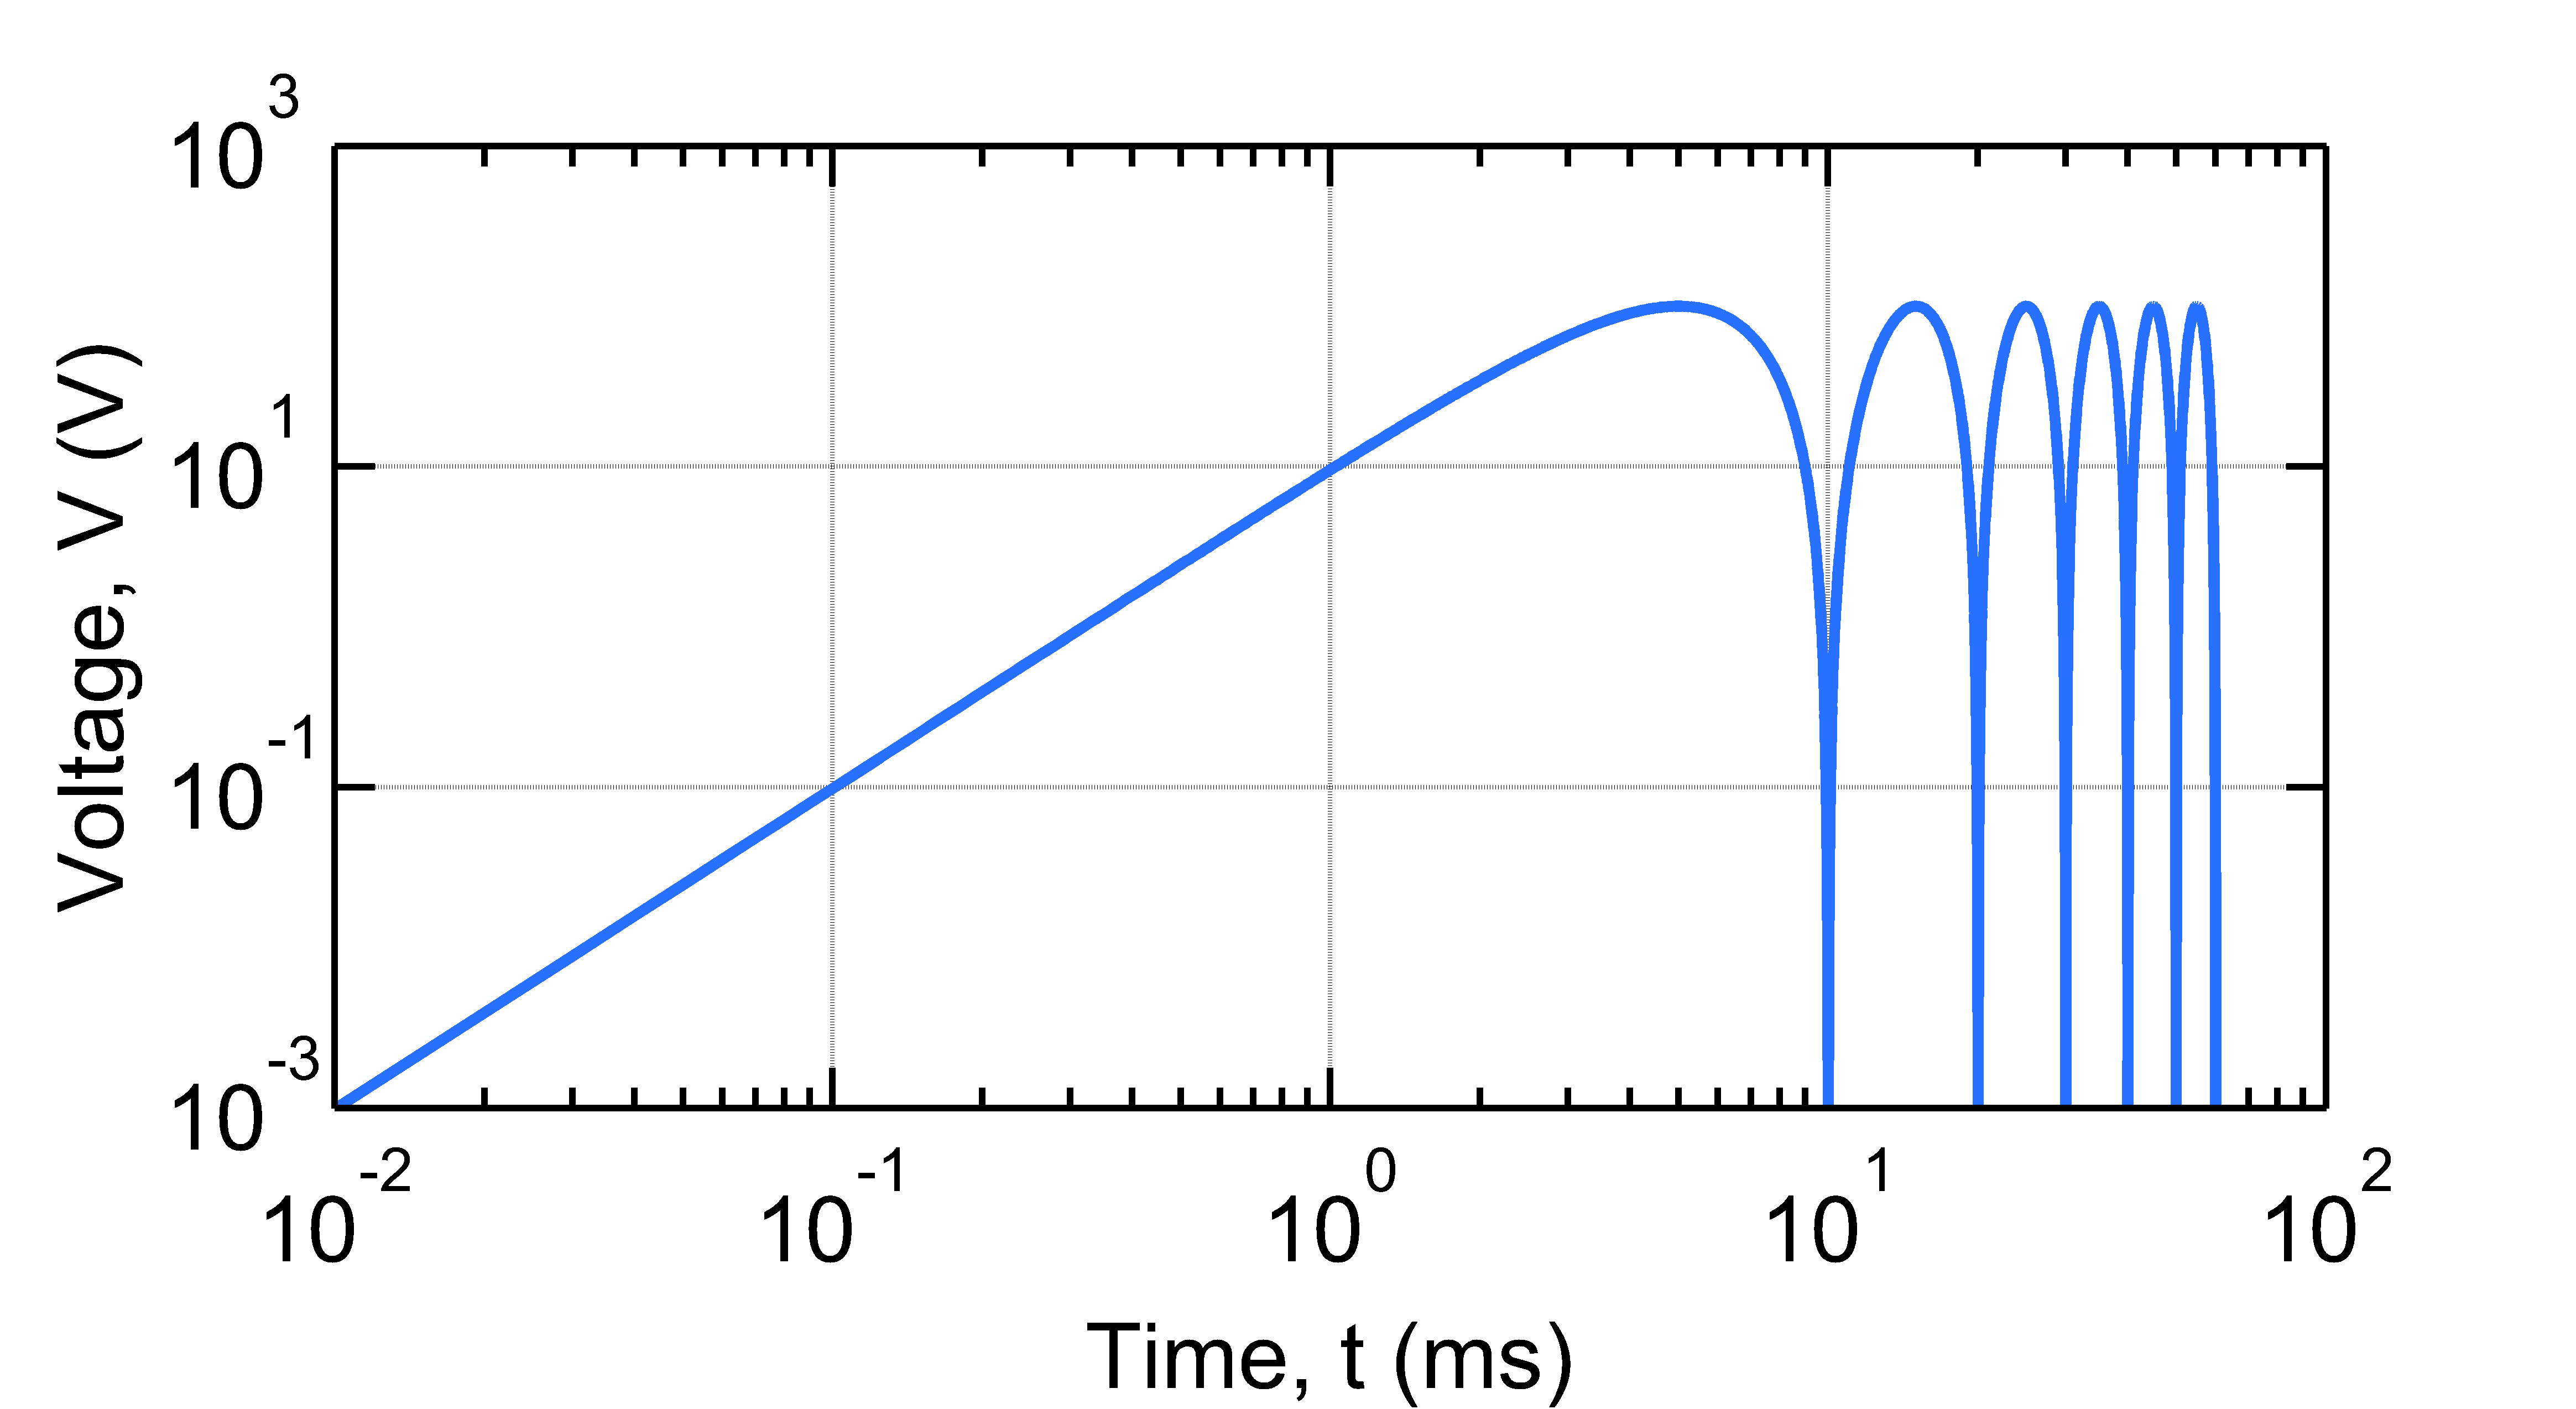
Showcasing plotpub - example plot in log scale.
Last update: 3:01 PM, Mar 19, 2015.