From Wikipedia, the free encyclopedia:
Inkscape is a free and open source software vector graphics editor. Its goal is to implement full support for the Scalable Vector Graphics (SVG) 1.1 standard. It also supports various other formats for Import/Export.
Using PlotPub, you can create publication quality figures using MATLAB. However, it does not support sub plots yet. Here, I am going to show you how to create publication quality subfigures using Inkscape and PlotPub.
Contents
Generating EPS files using PlotPub
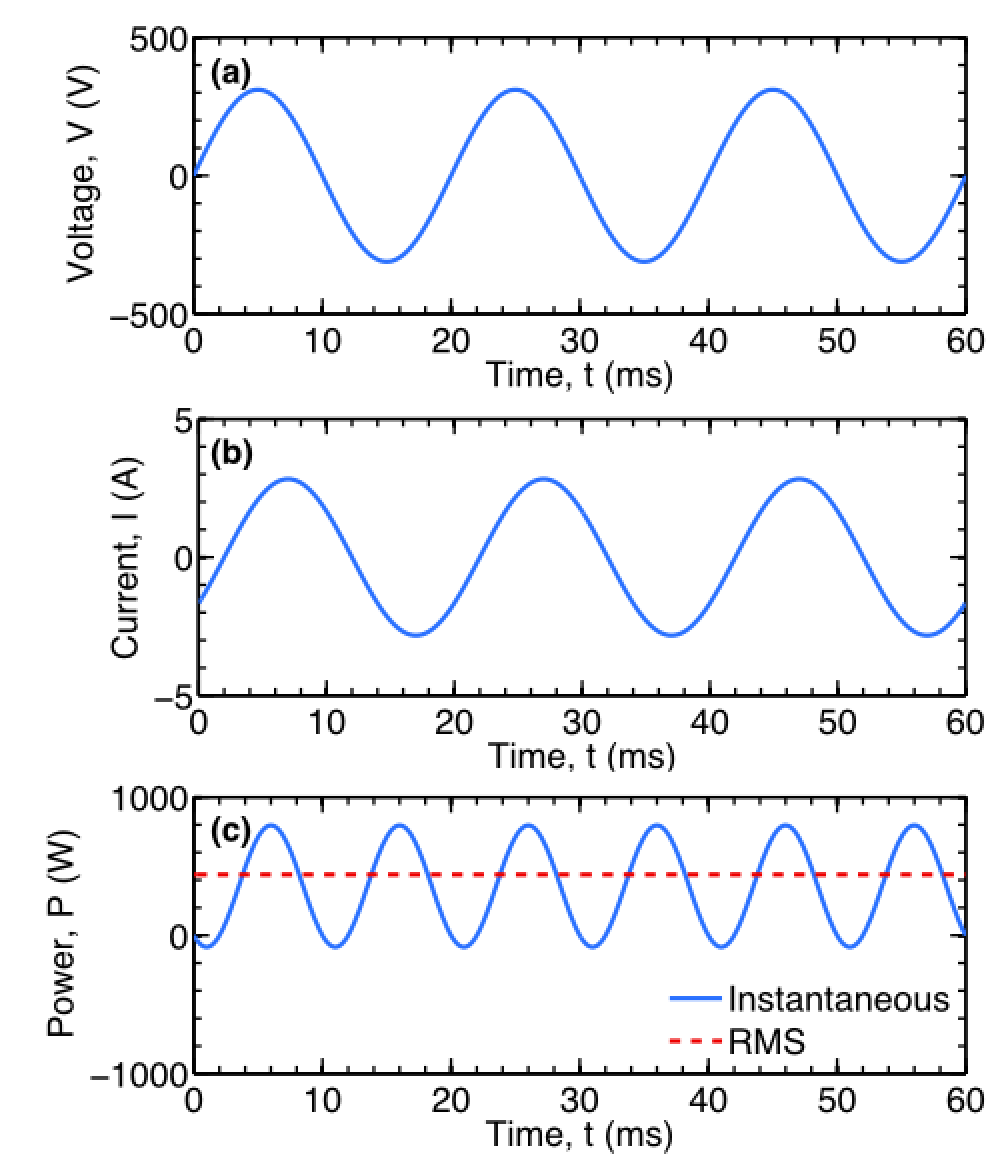
So, finally, you have nailed it. After months (seconds) of extreme-hard-work (scratching-your-head), you have just got this state-of-the-art, ground-breaking result. You have shown that instantaneous power of an induction motor can be expressed as a product of instantaneous voltage across and instantaneous current through the motor ;). Now it is time to publish the result and let the world know who is the boss :D.
So, you grabbed your computer and generated three EPS files (plotV.eps, plotI.eps and plotP.eps) using PlotPub (download the MATLAB script from the downloads section):
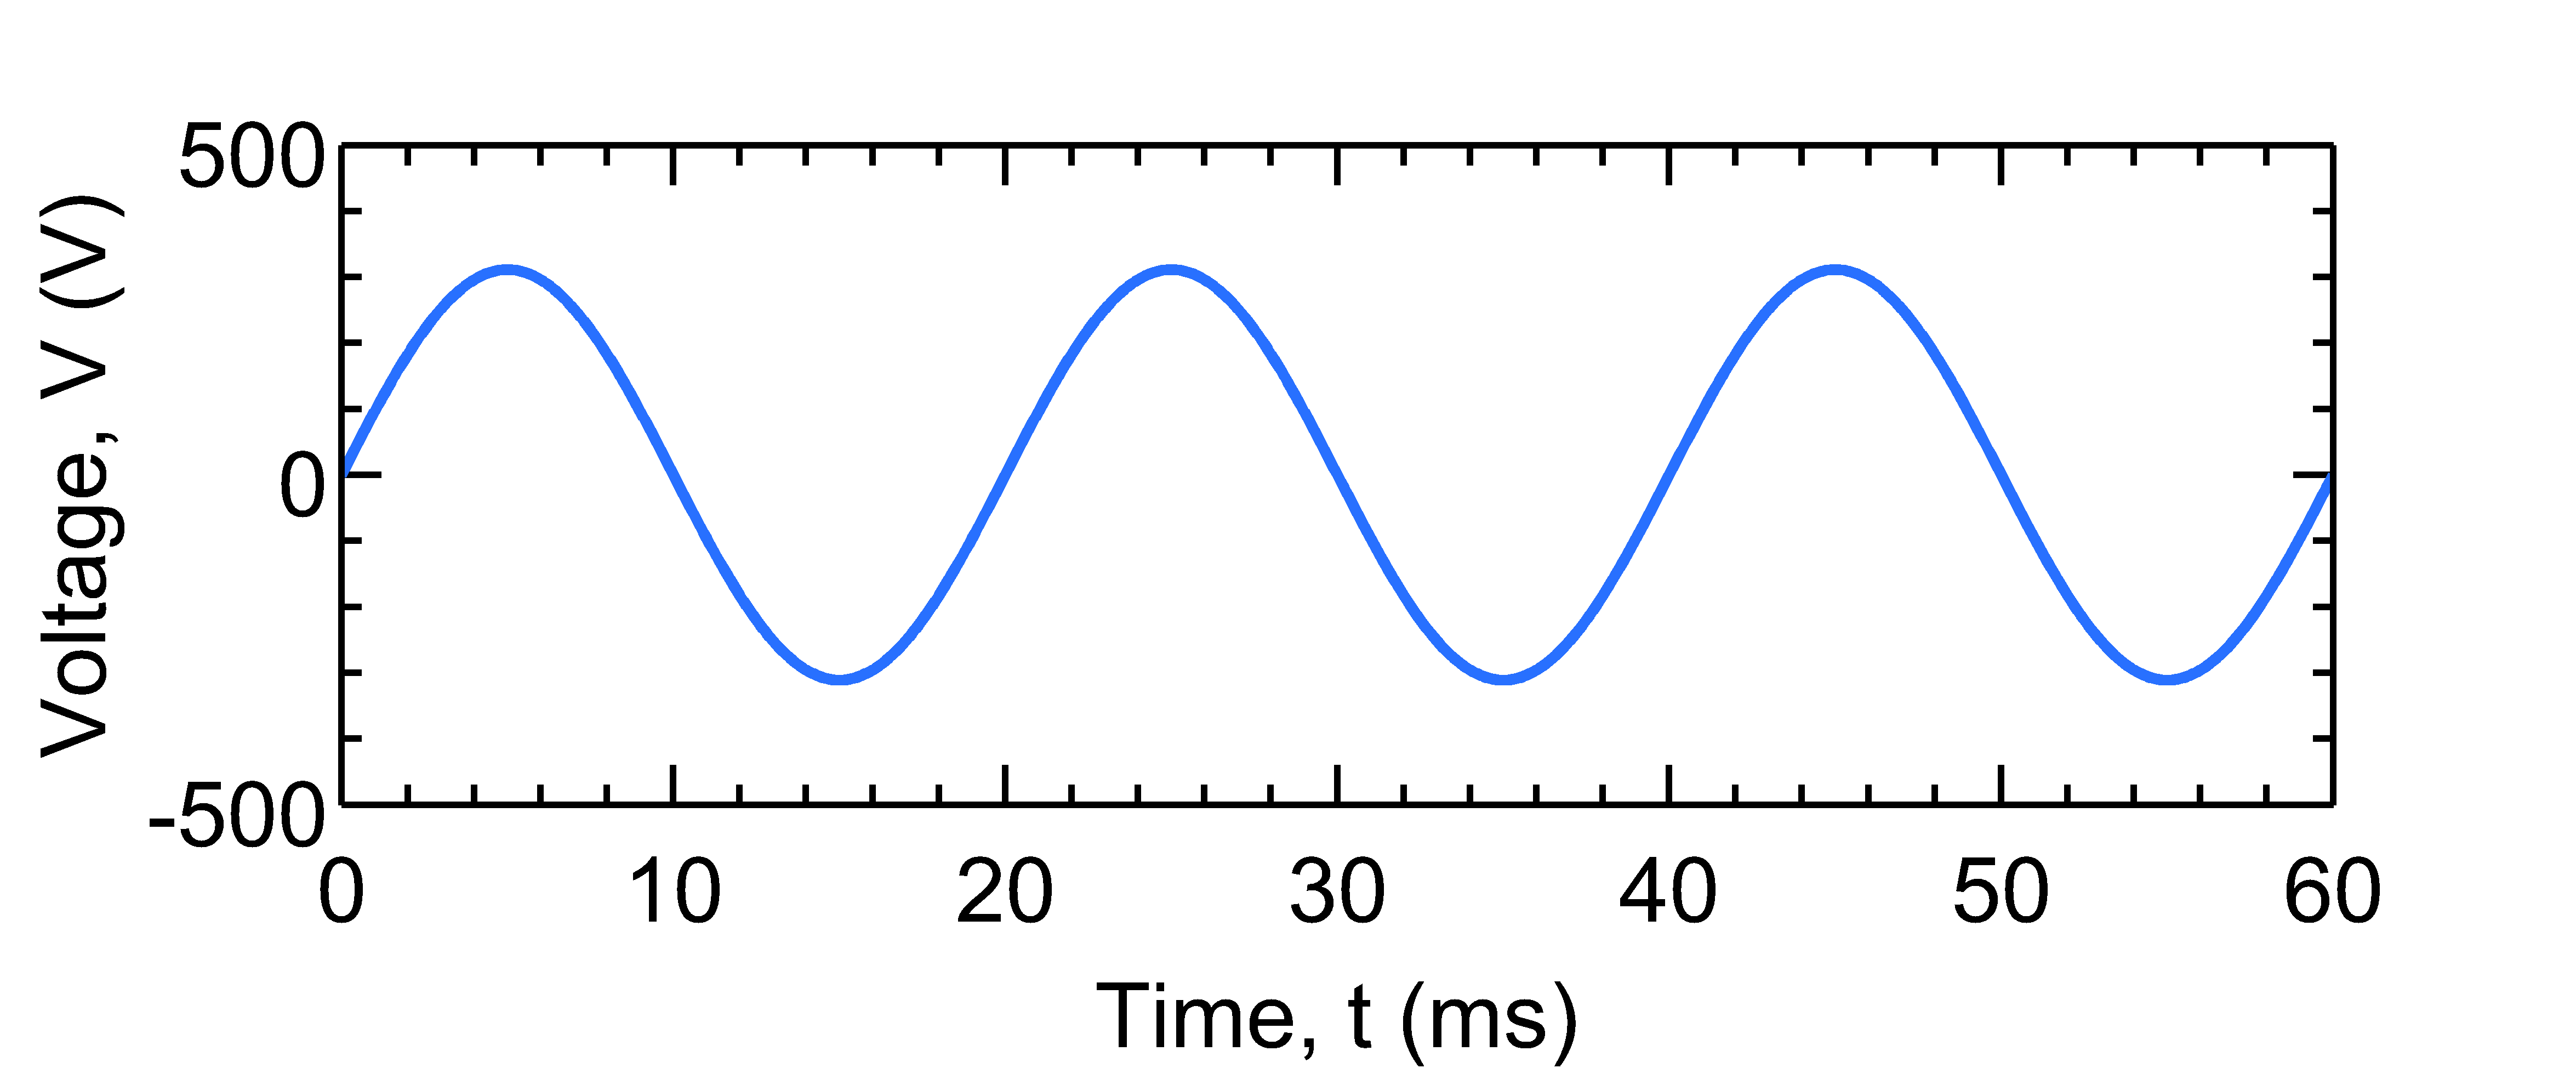
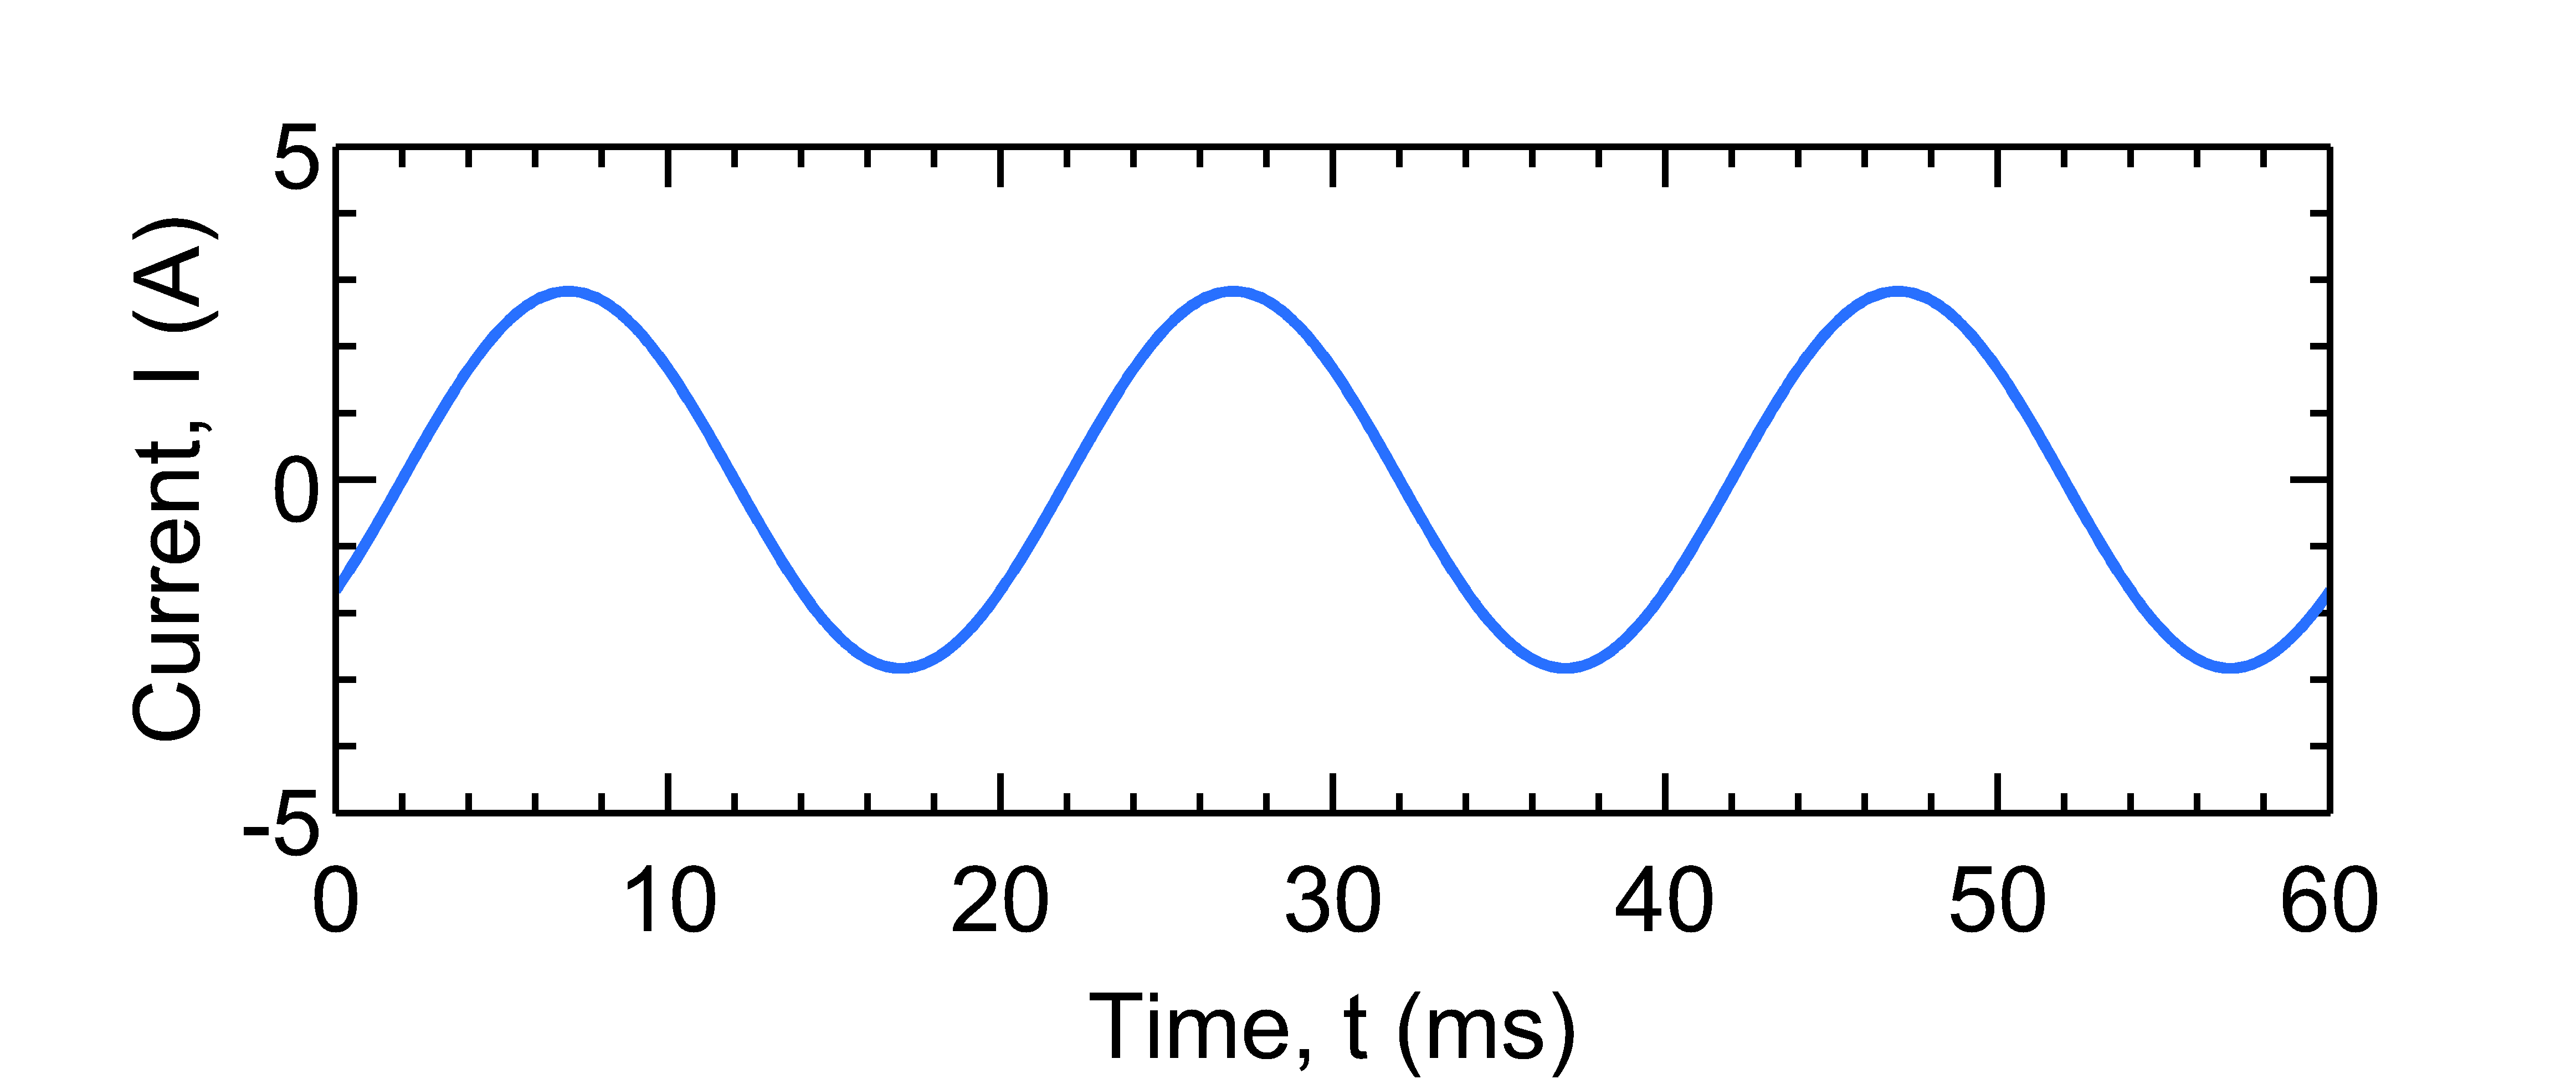
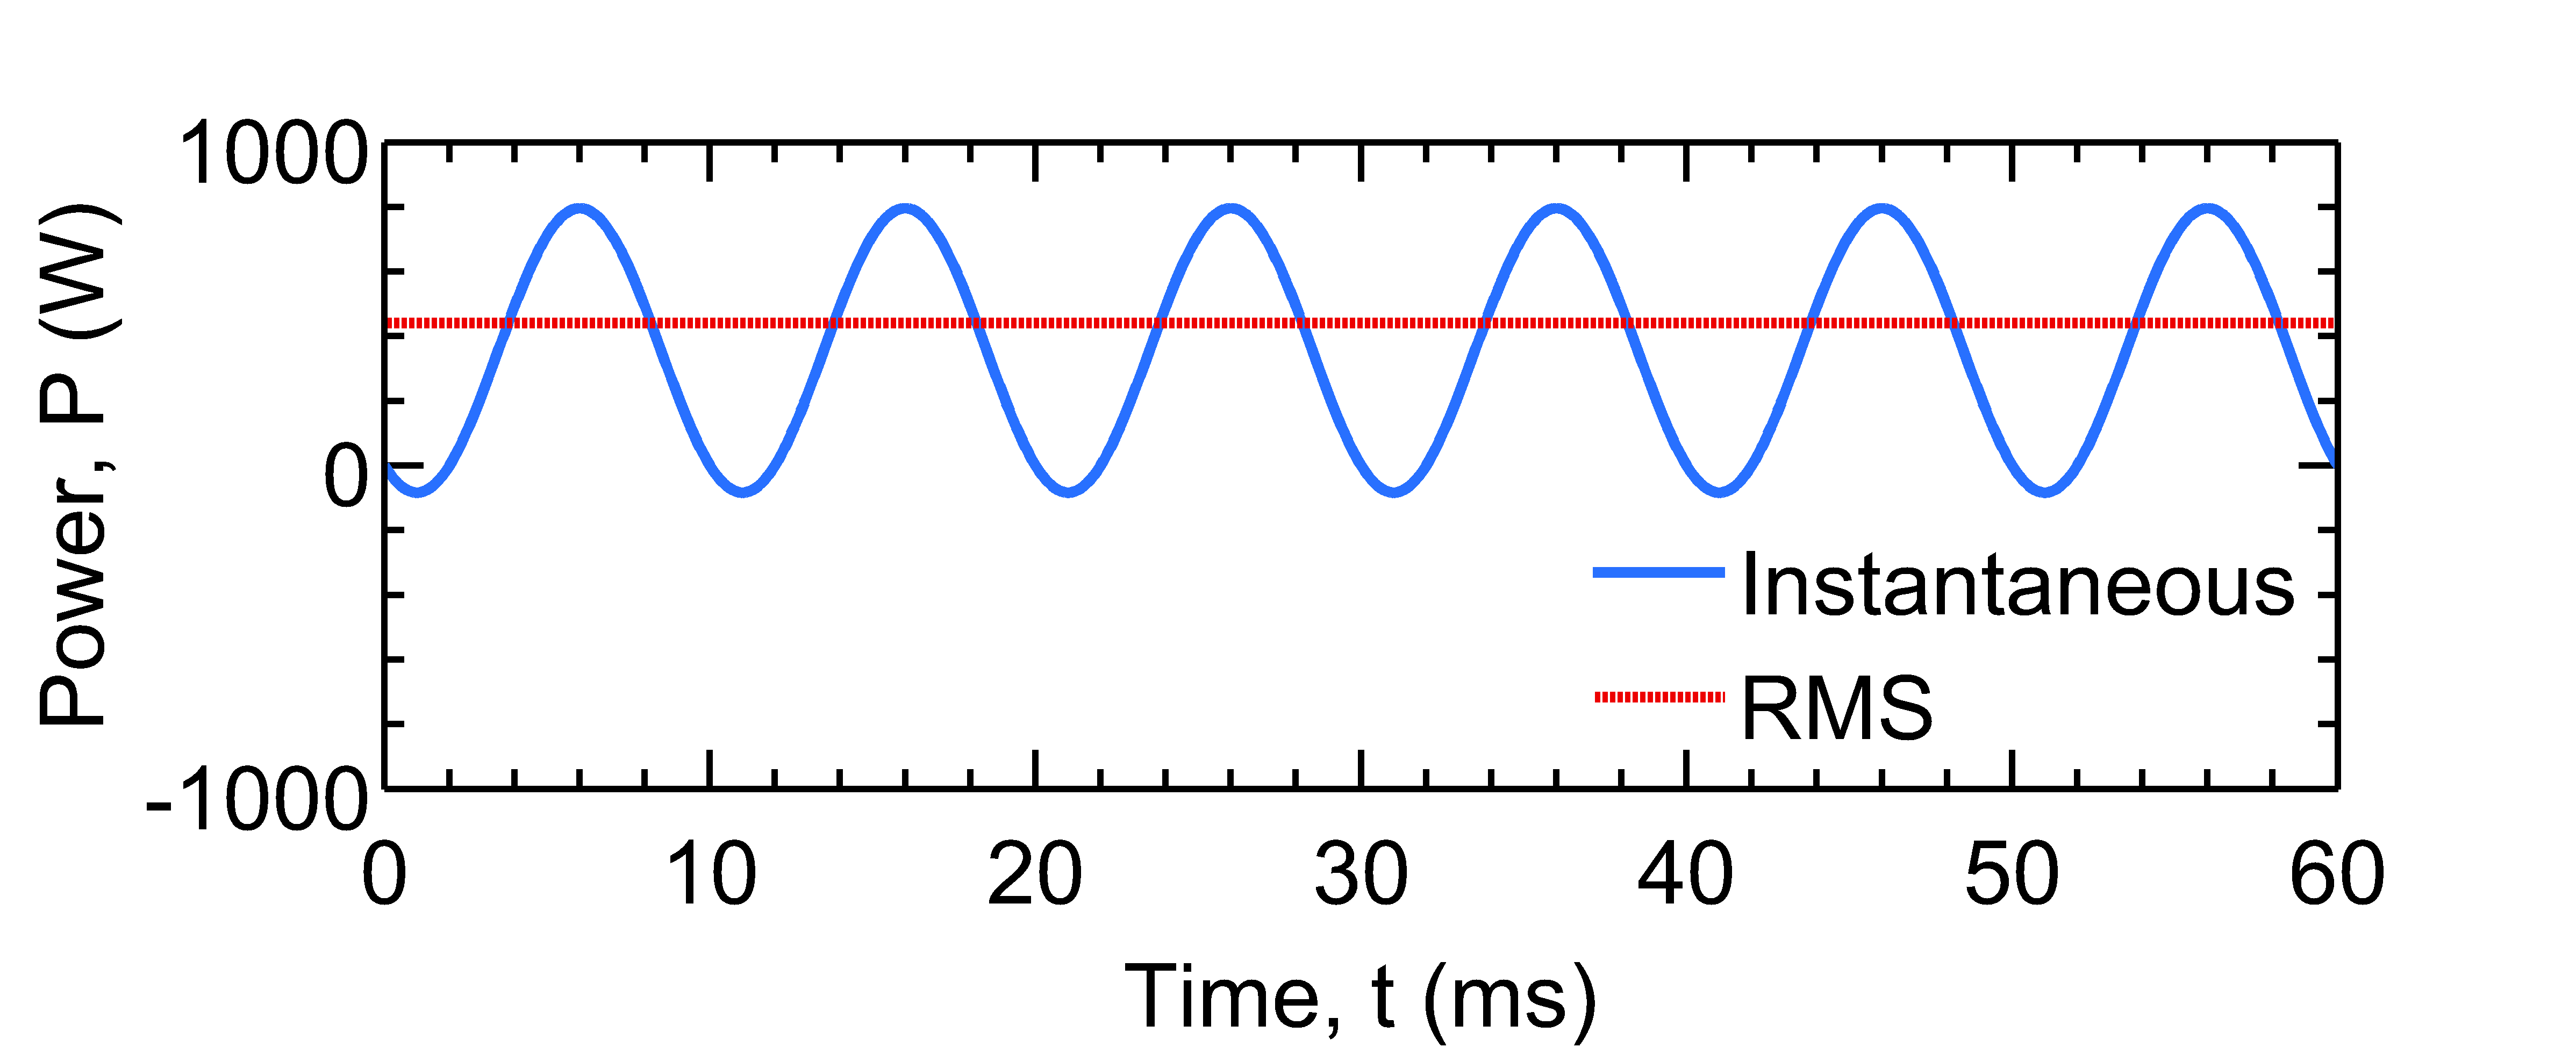
Now that you have three separate figures, the question is, how to combine them into one. No worries, Inkscape covers you.
Combining EPS files using Inkscape
Download and install Inkscape on your computer. The installation should be easy. But if you need, help is closer than you think.
Import
To start, open Inkscape and click the File > Import menu. A dialog box will appear. Browse your file system to select the voltage figure (plotV.eps) file and click Open. Make sure the import settings look like the following.
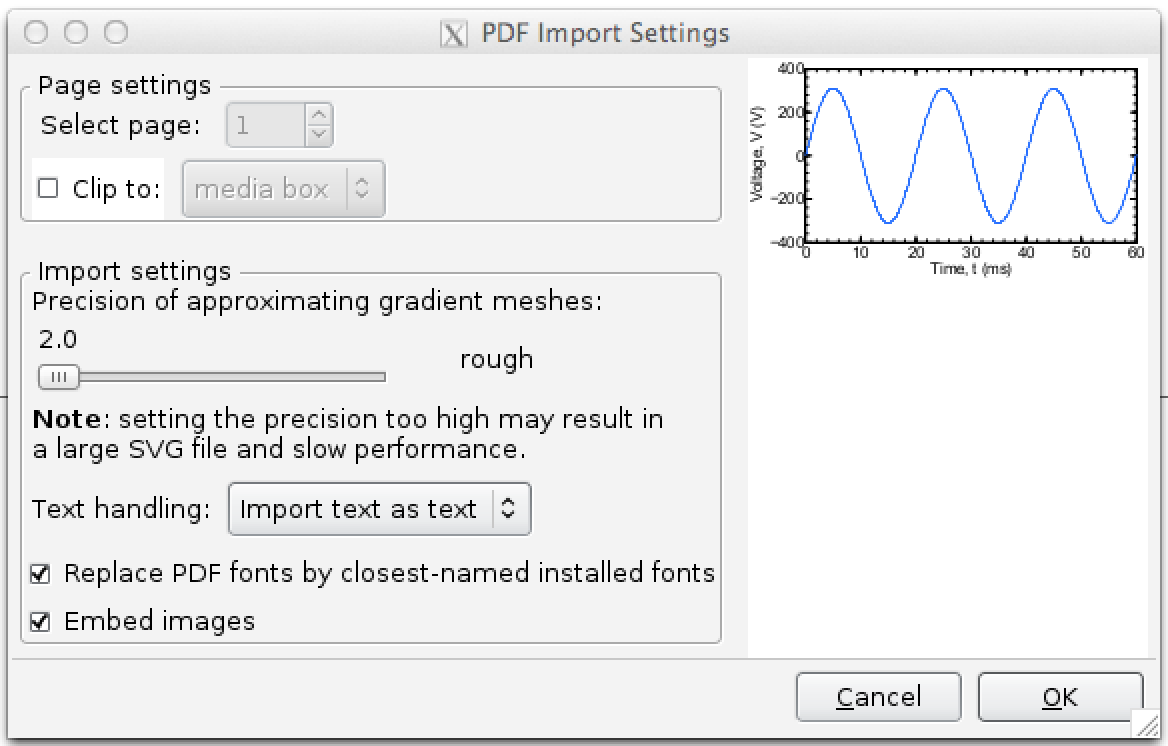
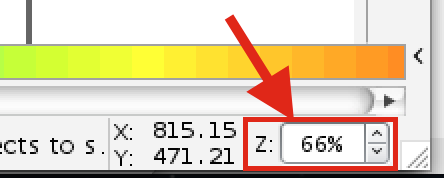
Click OK to complete the import. If your figure looks too small, you can change the zoom level from the bottom-right of your Inkscape window:
Similarly, import plotI.eps and plotP.eps.
Annotate
Choose the Select and transform object tool from the left toolbar:

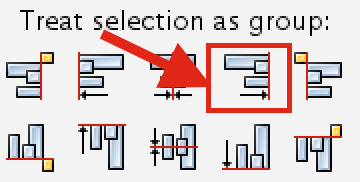
and select any one of the figures. Now you should be able to move the figure by dragging-and-dropping or by pressing the arrow keys. Now move the figures to arrange them one beneath the other. To align the figures, select them all then click Object > Align and Distribute menu. Now select Align right sides from the toolbox on the right hand side:
Now let's add labels to the figure. To add text, select Create text and edit objects from the left toolbox:

and click on the voltage plot and type (a). Now increase the font size from the toolbox:

Similarly create (b) and (c) labels and put them on current and power plots. When you are done, your figure should look like the following.
At this stage, it is a good idea to save your work. Click File > Save, provide a file name, choose Inkscape SVG (*.svg) as file type and click Save.
Export
To export your figure as an EPS file, select File > Save a Copy menu. Make sure you select Encapsulated PostScript (*.eps) as the file type and click Save. Encapsulated PostScript dialog box will appear. Make sure your options look like:
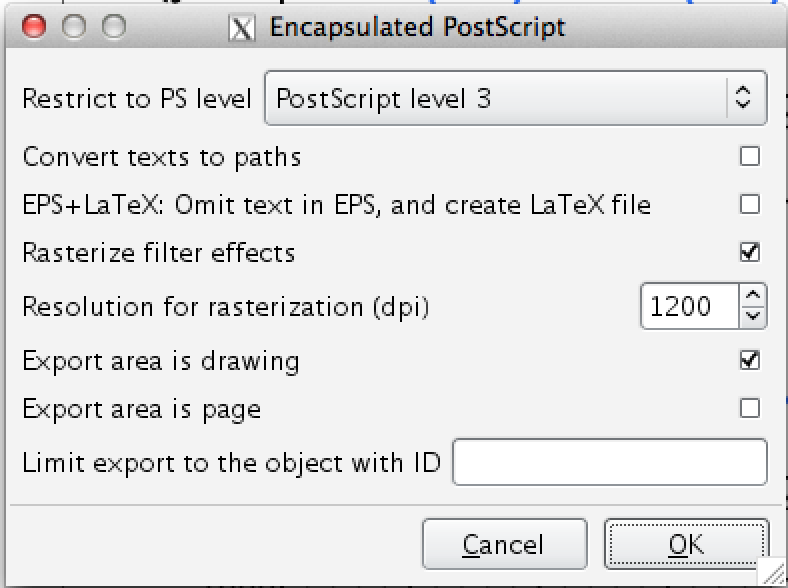
and click OK. This will create and EPS file containing three figures combined. Easy, right?
To export a PNG file, click File > Export Bitmap menu, the Export Bitmap dialog will appear. Select Drawing tab from the Export Area, enter 600 as dpi and choose a proper file name and location, and hit Export. A PNG image will be created.
Downloads
The download package contains the MATLAB script, the EPS files and the SVG files.
Inkscape is a very powerful tool that can be used to modify anything and everything of your figure. To do that, you first need to ungroup the figure. Select the figure you want to modify and then press Ctrl+Shift+G multiple times to ungroup everything. Now you should be able to add/edit/move any object in the figure. Click ... no, wait, that is enough for today.
Good luck with your Nobel prize though :-D.
Last update: 12:18 PM, September 28, 2014.
Comments